Measurable Data Token (MDT) Q3 2025 Price Prediction & Trend Analysis
1. MDT Project Overview
Measurable Data Token (MDT) is a decentralized data trading platform built on Ethereum and designed to disrupt the traditional internet’s data monopoly by enabling users to earn rewards for their data contributions. MDT’s flagship products, RewardMe and Measurable AI, serve individual users and enterprise clients, respectively. Rooted in real-world business needs, the project is committed to establishing a sustainable Web3 data economy.
2. Latest Market Overview
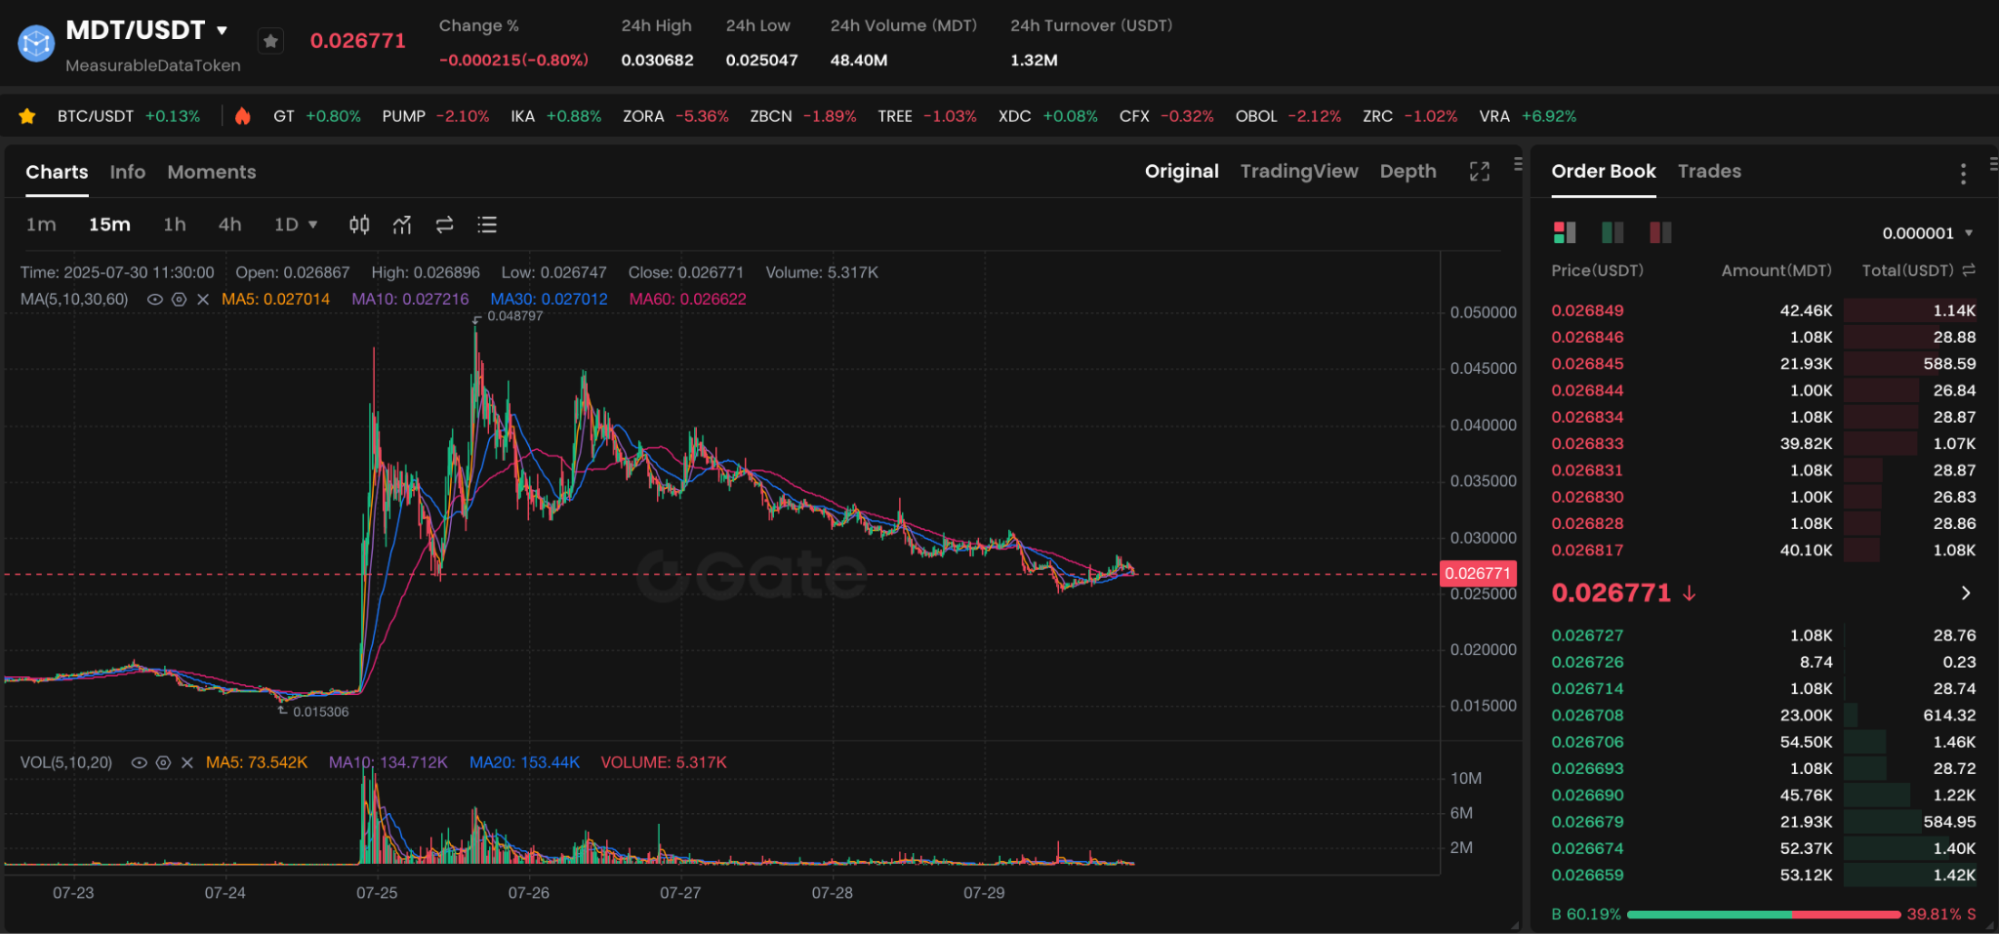
Chart: https://www.gate.com/trade/MDT_USDT
As of July 30, 2025, MDT is trading at $0.02719, down 5.24% in the past 24 hours. Its circulating market capitalization is approximately $18.4 million, with a 24-hour trading volume of nearly $16 million, which demonstrates robust liquidity. Over the last week, MDT attempted to break through the $0.03 resistance level but failed to sustain momentum above it.
According to data from the Gate platform, the MDT/USDT trading pair has experienced significant volatility recently, with active short-term trading. Investor sentiment has been heavily influenced by broader market conditions.
3. Recent Catalysts
- Platform Upgrade: Last week, MDT completed an upgrade of its data trading engine, integrating more efficient encryption algorithms and a user-friendly front-end interface, which should attract more data providers to the ecosystem.
- Expansion of Strategic Partnerships: MDT announced a partnership with a leading retail group in Southeast Asia to launch a pilot project for on-chain user shopping data. These collaborations expand the token’s utility and drive real-world adoption.
- Macro Market Adjustment: The broader crypto market experienced a brief pullback at the end of July, which affected MDT as well. Nonetheless, MDT’s decline was relatively modest, reflecting some resilience.
4. Technical Analysis
- Candlestick Pattern: On the daily chart, MDT has formed a narrow descending channel, with support near $0.025 and resistance near $0.032.
- RSI Indicator: The current RSI is approximately 42, still above the oversold threshold, indicating potential for a rebound.
- Bollinger Bands: The bands are contracting, suggesting a new directional move may be imminent.
5. Short-term Price Forecast
Over the next 2–4 weeks, MDT is likely to fluctuate within the following ranges:
- Support: $0.024–$0.025
- Primary resistance: $0.030–$0.032
- If MDT breaks above this upper range with strong volume, it may test the $0.035 level.
6. Investment Advice
- For new investors, we recommend a dollar-cost averaging (DCA) strategy with incremental purchases to avoid the risk of lump-sum entry.
- Stay up to date with updates and partnership news from MDT’s official channels and X (formerly Twitter) to stay informed about project milestones.
- Set clear profit-taking and stop-loss points—for example, a target price of $0.032 and a stop-loss price of $0.024—to manage risk effectively.
Related articles

Pi Coin Transaction Guide: How to Transfer to Gate.io

What is N2: An AI-Driven Layer 2 Solution

Grok AI, GrokCoin & Grok: the Hype and Reality

How to Sell Pi Coin: A Beginner's Guide

Crypto Trends in 2025
